CBA Hypomonitor: A slight increase in the mortgage rate to 4.67% sustained solid activity in May
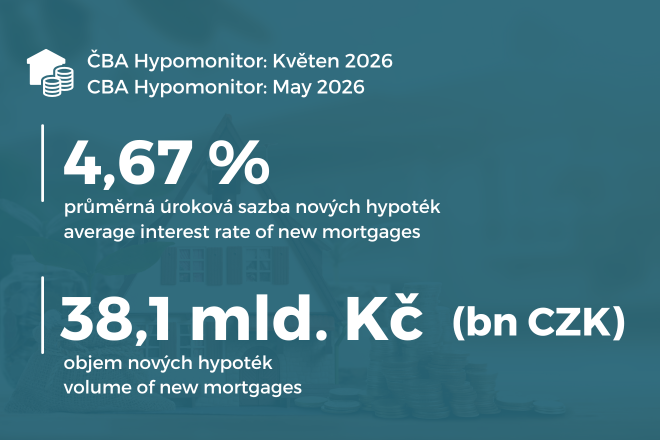
Table 1: Summary of the volume of mortgages granted and average interest rates for May 2026
Monthly figures | Values since the beginning of the year | ||||||
| Number |
| Volume | Number |
| ||
Total | 52.6 | 11,449 | 4.63 | 245.3 | 54,434 | 4.50 | |
New loans | 38.1 | 7,871 | 4.67 | 179.4 | 37,727 | 4.52 | |
of which: | |||||||
for the purchase | 26.2 | 5,399 | 4.68 | 129.5 | 27,281 | 4.51 | |
for construction | 7.5 | 1,557 | 4.59 | 29.2 | 6,188 | 4.47 | |
other | 4.4 | 915 | 4.77 | 20.7 | 4,258 | 4.59 | |
Refinanced from another institution | 12.4 | 3,095 | 4.50 | 55.6 | 14,205 | 4.43 | |
Refinanced internally, increased | 2.1 | 483 | 4.64 | 10.3 | 2,502 | 4.47 | |
Source: CBA Hypomonitor. Note: seasonally unadjusted data
Jaromír Šindel, chief economist of the Czech Banking Association adds“Mortgage activity slowed in May, which is not surprising given the likely strong build-up in demand in previous months. However, both the number of new mortgages—over 7,000—and the volume—around 35 billion—remained higher than at the end of last year after seasonal adjustment. This was also aided by a relatively modest increase in mortgage interest rates to 4.67% for new mortgages and 4.5% for external refinancing,”


Activity slowed in May but returned to the still-strong levels seen at the end of last year
Michal Neubauer, mortgage specialist at UniCredit Bank adds“The mortgage market continues to face pressure from external factors. The current geopolitical situation in the Middle East is contributing to uncertainty in the financial markets and keeping mortgage interest rates at elevated levels. Unfortunately, we do not yet see any clear signs that the situation will improve significantly in the near future,”


Miloš Jelínek, head of mortgage lending at Fio Bank notes“The mortgage market remains active, but the main concern for clients is no longer just the interest rate itself. Rising property prices are playing an increasingly significant role, as they increase both the average mortgage amount and the requirements for down payments. Rates continued to fall slightly from January through March, but rose again in April, a trend reflected in our offerings. Further significant rate cuts are being constrained by trends in longer-term market rates. From the clients’ perspective, therefore, the key factors in the coming months will be not only the rate itself, but primarily the overall affordability of the payments and sufficient financial reserves. “We continue to see strong demand in the real estate market amid limited supply, which is keeping prices high—particularly for apartments—and further complicating housing affordability,”


Source: CBA Hypomonitor
Note: These are truly new mortgages (i.e., excluding refinancing and loan increases). The underlying data is available in an XLS file attached to the CBA Hypomonitor website. The outlook through the end of the year (fcst) is momentum-based – it is based on the current trend, not on a model prediction. However, for the remainder of the year, it anticipates a 7% correction in the number of mortgages.
Chart 8: Breakdown of New Mortgage Loans by Purpose

Source: CBA Hypomonitor
Note: The latest figure represents the average for the past 12 months. The interpretation of the “other” segment may be distorted by the inclusion of so-called mortgages without real estate, arranged without a specific purpose. For more details, see the methodological note below.
Chart 1: Annual volume, number, and average amount of mortgages granted from 2020 to 2025

Source: CBA Hypomonitor
Methodology of the CBA Hypomonitor
The CBA Hypomonitor categorizes mortgage loans provided by banks and building societies to households into several categories to distinguish new loans from refinanced loans or internal rate adjustments. New loans are then reported in categories based on the purpose of the loan:
1. New Loans
These are loans whose entire volume enters the economy for the first time. This category does not include loan consolidation or loan refinancing. They are divided into three categories:
Real estate purchase
Real estate construction – including real estate renovation
Other new agreements – only new loans that are not related to the purchase or construction of real estate (which does not apply in the case of so-called mortgages without real estate agreed without a purpose), i.e. so-called American mortgages, settlement of SJM, refund of the purchase price, settlement of inheritance shares, settlement of cooperative shares, etc.
2. Refinanced loans from another financial institution
These are loans created by refinancing one or more loans from a financial institution other than the reporting one. Regardless of the amount refinanced and regardless of the amount of any increase, the total amount of the newly created loan is reported in this category.
3. Increased or internally refinanced loans
These are loans that were already part of the reporting entity’s portfolio in the previous reporting period and for which one of the following changes occurred during the reporting period:
an increase in the agreed amount
changes occurred such that the original loan was refinanced/converted into a new loan within the reporting entity. This constitutes a truly new contract, not merely a new arrangement within the framework of a refixation of an existing contract. Therefore, the volume of such loans in the CBA statistics is lower compared to “other new arrangements” in the Czech National Bank’s statistics.
Data for the CBA Hypomonitor are provided by the following banks and building societies: Air Bank, Česká spořitelna, ČSOB, ČSOB Stavební spořitelna, Fio banka, ČSOB Hypoteční banka, Komerční banka, mBank, Modrá pyramida, MONETA Bank, Oberbank, Partners Banka, Raiffeisen stavební spořitelna, Raiffeisenbank, UniCredit Bank.